The Record — Majors Series
How to Read the Print
I
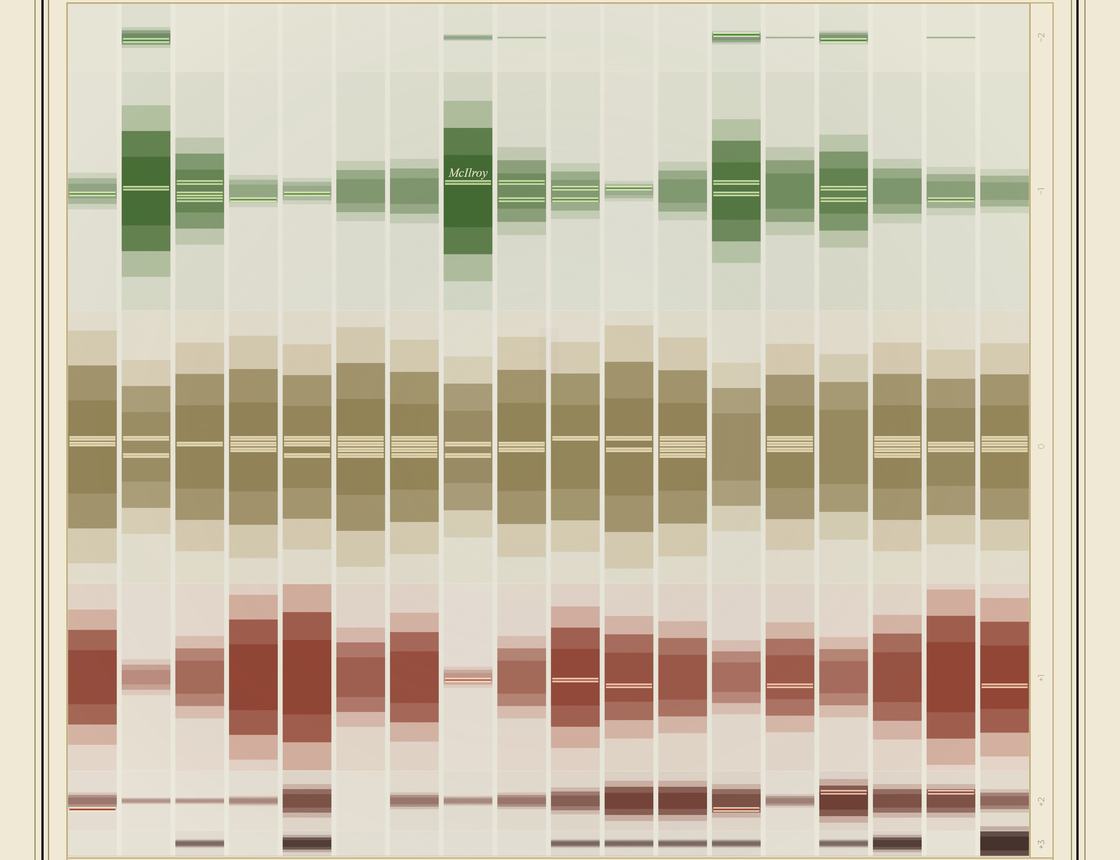
Field Distribution
Every player, every hole, every round. Each column is a hole; each horizontal band shows how many players scored at that level. Eagles and birdies appear in one color family, pars in another, bogeys and worse in another — making it immediately visible where the course yielded scores and where it took them away. The score-to-par markers on the right edge label each scoring band. The highlighted bars running through the chart are the champion’s, showing exactly what they scored on every hole they played.

II
72-Hole Scoring by Hole
The hole number sits above each column; par below it. Each segment shows the share of the field that made that score across all four rounds combined. The colors match the fingerprint above.

III
Tournament Record & Editorial
Field size, cut, par, yardage, and purse place the championship in context. The three vignettes on the right capture the moments and characters that the data alone cannot tell.
IV
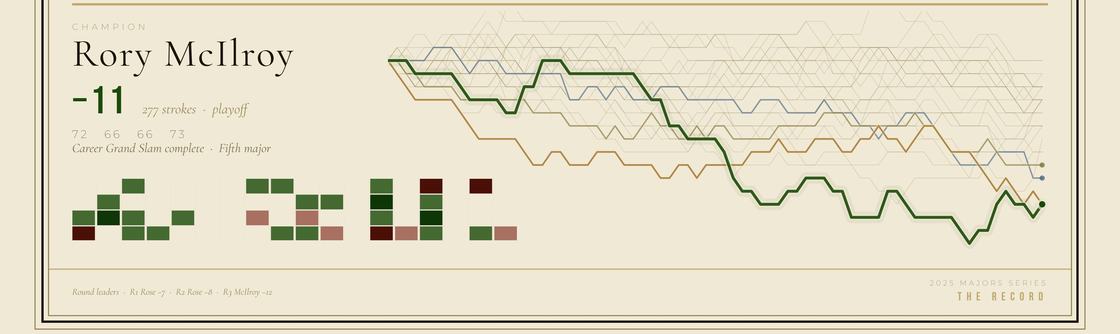
Champion & Trajectory
The mosaic shows the champion’s personal scoring pattern across all 72 holes, each square colored by result using the same palette as the fingerprint. The trajectory chart traces cumulative score-to-par for the leading contenders hole by hole — where lines cross, leads change. Along the bottom, the round leaders record who held the top of the leaderboard at the end of each day.